 Facebook
 Twitter
 LinkedIn
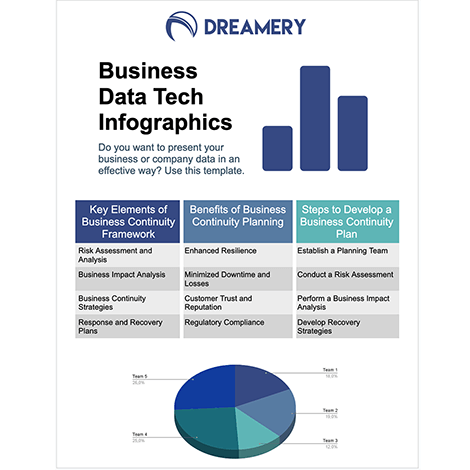

Business Data Tech Infographics Do you want to present your business or company data in an effective way? Use this template. |

Key Elements of Business Continuity Framework | Benefits of Business Continuity Planning | Steps to Develop a Business Continuity Plan |
Risk Assessment and Analysis | Enhanced Resilience | Establish a Planning Team |
Business Impact Analysis | Minimized Downtime and Losses | Conduct a Risk Assessment |
Business Continuity Strategies | Customer Trust and Reputation | Perform a Business Impact Analysis |
Response and Recovery Plans | Regulatory Compliance | Develop Recovery Strategies |

Trusted By